Netdata Monitoring System - Real-Time, Free, and Easy
Netdata is a free, open-source, and lightweight monitoring solution for servers, containers, and applications. It provides real-time insights into your system’s health, performance, and resource usage—all with beautiful, interactive dashboards. Whether you’re a home lab enthusiast or running enterprise infrastructure, Netdata is a fantastic tool to have in your monitoring arsenal.
Why Netdata?
- Free & Open Source: 100% free for personal and commercial use. GitHub repo
- Real-Time Monitoring: See metrics update instantly—no more waiting for slow polling intervals.
- Lightweight: Minimal resource usage, suitable for even small VMs or Raspberry Pi.
- Easy Setup: Get started in minutes with a single command.
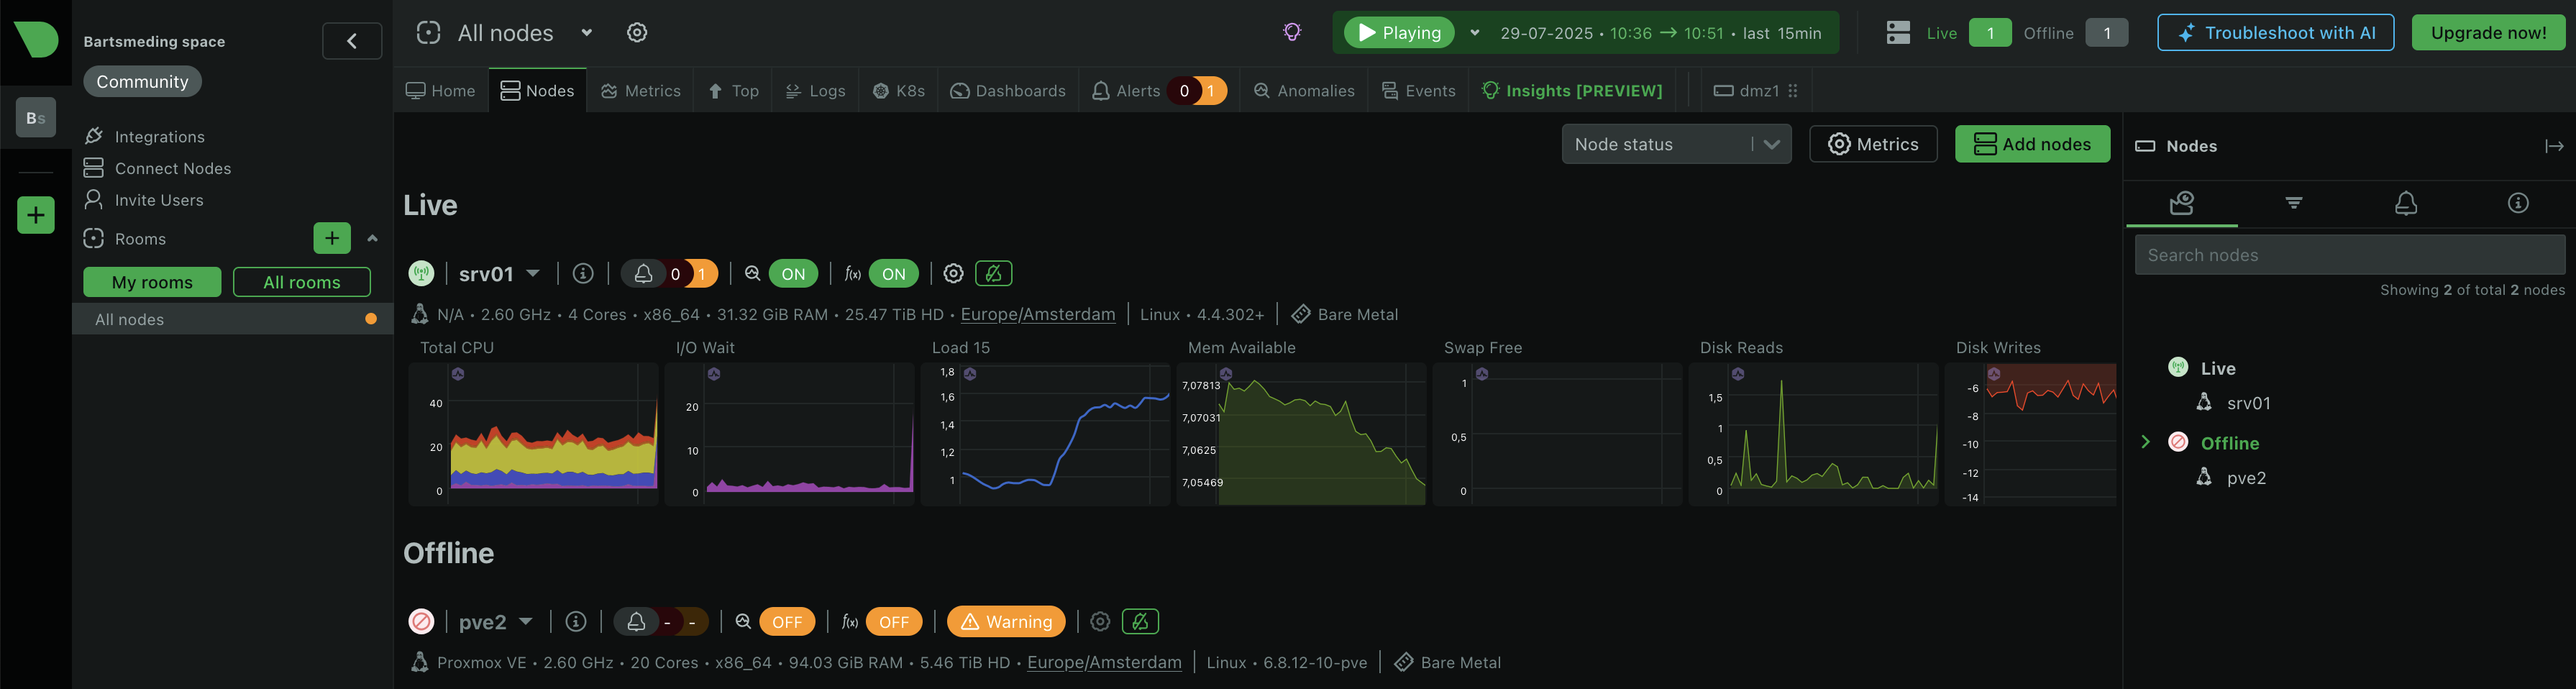
- Beautiful Dashboards: Interactive web UI with hundreds of prebuilt charts.
- Extensible: Monitor everything from CPU and memory to Docker, Nginx, databases, and more.
- Enterprise Features: Optional cloud, alerting, and team features for larger environments.
Typical Use Cases
- Home labs and personal servers
- Docker and Kubernetes monitoring
- Small business and enterprise infrastructure
- Troubleshooting performance issues
- Visualizing resource usage over time
How to Install Netdata
1. Quick Start (One-Line Install)
The fastest way to get Netdata running on most Linux systems:
- This script auto-detects your OS and installs Netdata as a service.
- After install, access the dashboard at: http://localhost:19999
Security Tip: Always review install scripts before running them in production.
2. Docker Deployment
Netdata is also available as a Docker container. For best practice, mount all persistent data under /opt/netdata/ on your host:
docker run -d \
  --name=netdata \
  -p 19999:19999 \
  -v /opt/netdata/config:/etc/netdata \
  -v /opt/netdata/lib:/var/lib/netdata \
  -v /opt/netdata/cache:/var/cache/netdata \
  -v /etc/passwd:/host/etc/passwd:ro \
  -v /etc/group:/host/etc/group:ro \
  -v /proc:/host/proc:ro \
  -v /sys:/host/sys:ro \
  -v /etc/os-release:/host/etc/os-release:ro \
  --restart unless-stopped \
  --cap-add SYS_PTRACE \
  --security-opt apparmor=unconfined \
  netdata/netdata
- This setup keeps all Netdata configuration, state, and cache files organized under
/opt/netdata/on your host. - Visit http://localhost:19999 after starting the container.
- For more options, see the Netdata Docker docs.
Coming soon: I will publish an Ansible role to automate Netdata deployment with Docker as part of my automation resources. Stay tuned!
3. Other Installation Methods
Basic Configuration
Netdata works out of the box, but you can customize it for your needs.
Main Config File
- Location:
/opt/netdata/config/netdata.conf(host) or/etc/netdata/netdata.conf(in container) - To edit:
- Example: Change the default dashboard port
Enable/Disable Plugins
- Netdata auto-detects most services, but you can enable/disable plugins in
/opt/netdata/config/netdata.confor in thepython.dandgo.dplugin directories under/opt/netdata/config/. - Example: Enable the Nginx plugin
Monitoring Network Devices with SNMP and gRPC
Netdata can monitor network devices such as switches, routers, and firewalls using standard protocols like SNMP (Simple Network Management Protocol) and gRPC. This allows you to visualize interface statistics, CPU/memory usage, and more from your network infrastructure alongside your servers and containers.
SNMP Monitoring
- SNMP is widely supported by network devices for exposing metrics.
- Netdata uses the
snmpplugin to poll devices and display their data. - Typical use cases: switches, routers, firewalls, printers, UPS devices, etc.
Example SNMP configuration (/opt/netdata/config/python.d/snmp.conf):
- After editing, restart Netdata:
sudo systemctl restart netdata(or restart the container). - See Netdata SNMP docs for more details and module options.
gRPC Monitoring
- gRPC is a modern, high-performance protocol used by some next-gen network devices and platforms.
- Netdata supports gRPC for certain integrations (see Netdata gRPC docs).
- Example use cases: cloud-native network appliances, SDN controllers, or custom telemetry exporters.
Example gRPC configuration (/opt/netdata/config/go.d/grpc.conf):
- Adjust the address and metrics as needed for your device/platform.
For more on network device monitoring and automation, see my network automation resources and Ansible tutorials.
First Steps After Install
- Open the Dashboard: Go to http://localhost:19999 in your browser.
- Explore Metrics: Click through the charts for CPU, memory, disk, network, containers, and more.
- Set Up Alerts: Netdata comes with built-in alerting. Configure notifications in
/etc/netdata/health_alarm_notify.conf. - Add More Nodes: Use Netdata Cloud (free tier available) to monitor multiple systems from a single dashboard.
- Note: To use the Netdata Cloud dashboard, you need to create an online space (organization) in Netdata Cloud and link your nodes to it. This lets you manage and view all your systems in one place, invite team members, and access advanced features. See the official guide.
Enterprise & Cloud Features
- Netdata Cloud: Centralized monitoring, team access, and long-term metrics storage. Learn more
- Advanced Alerting: Integrate with Slack, email, PagerDuty, and more.
- Role-Based Access: Manage who can see and edit dashboards.
- Data Retention: Store metrics for longer periods in the cloud.
Screenshots & Visuals
Coming soon!
- [Insert screenshot - Netdata dashboard overview]
- [Insert screenshot - Docker container metrics]
- [Insert screenshot - Health alerts configuration]
Troubleshooting & Tips
- Netdata not starting? Check logs:
sudo journalctl -u netdataordocker logs netdata - Firewall issues? Ensure port 19999 is open.
- Performance: Netdata is lightweight, but you can tune data collection and retention in the config.
- Security: For public dashboards, use a reverse proxy with authentication.
Resources & Further Reading
- Netdata Documentation
- Netdata GitHub
- Netdata Docker Hub
- Netdata Cloud
- Monitoring with Docker: Blog Post
- Other Monitoring Tools
Feedback
Have you used Netdata? Share your tips, questions, or screenshots in the comments! For more monitoring and automation content, check out our blog and network automation resources.